Gold
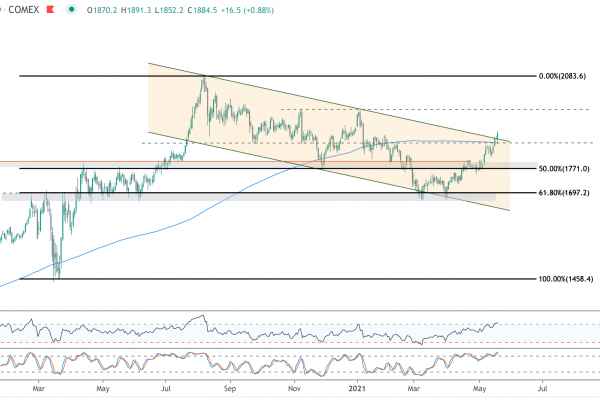
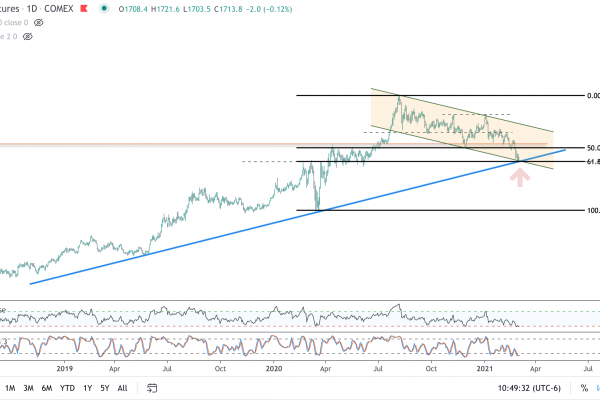
Metals bulls have been frustrated with repeated attempts to break out of a multi-month bull flag/falling channel. At the turn of the new year, with the presidential election all but behind the country, and with calls for more money-printing and ongoing stimulus, it seemed a given that – like the base metals and energy – gold would break out and follow the inflation narrative to higher prices. And, for three days, that is just what happened, as gold pushed from a 2020 close of $1895 to $1960 in the first three days of the new year, only to sell off hard and fall back below falling trend line support. This was gold’s second pass at $1960, which was the 6.18% Fibonacci retracement from the August high to the November low. As the saying goes, from failed moves come fast moves, and the failed move precipitated a $160 sell-off in a week and a half ($140 of which occurred in the 3 days following the peak). It was a major head fake for bulls and stopped out many traders who bought the breakout. Price also lost the 200-day moving average, which was another warning sign for bulls.
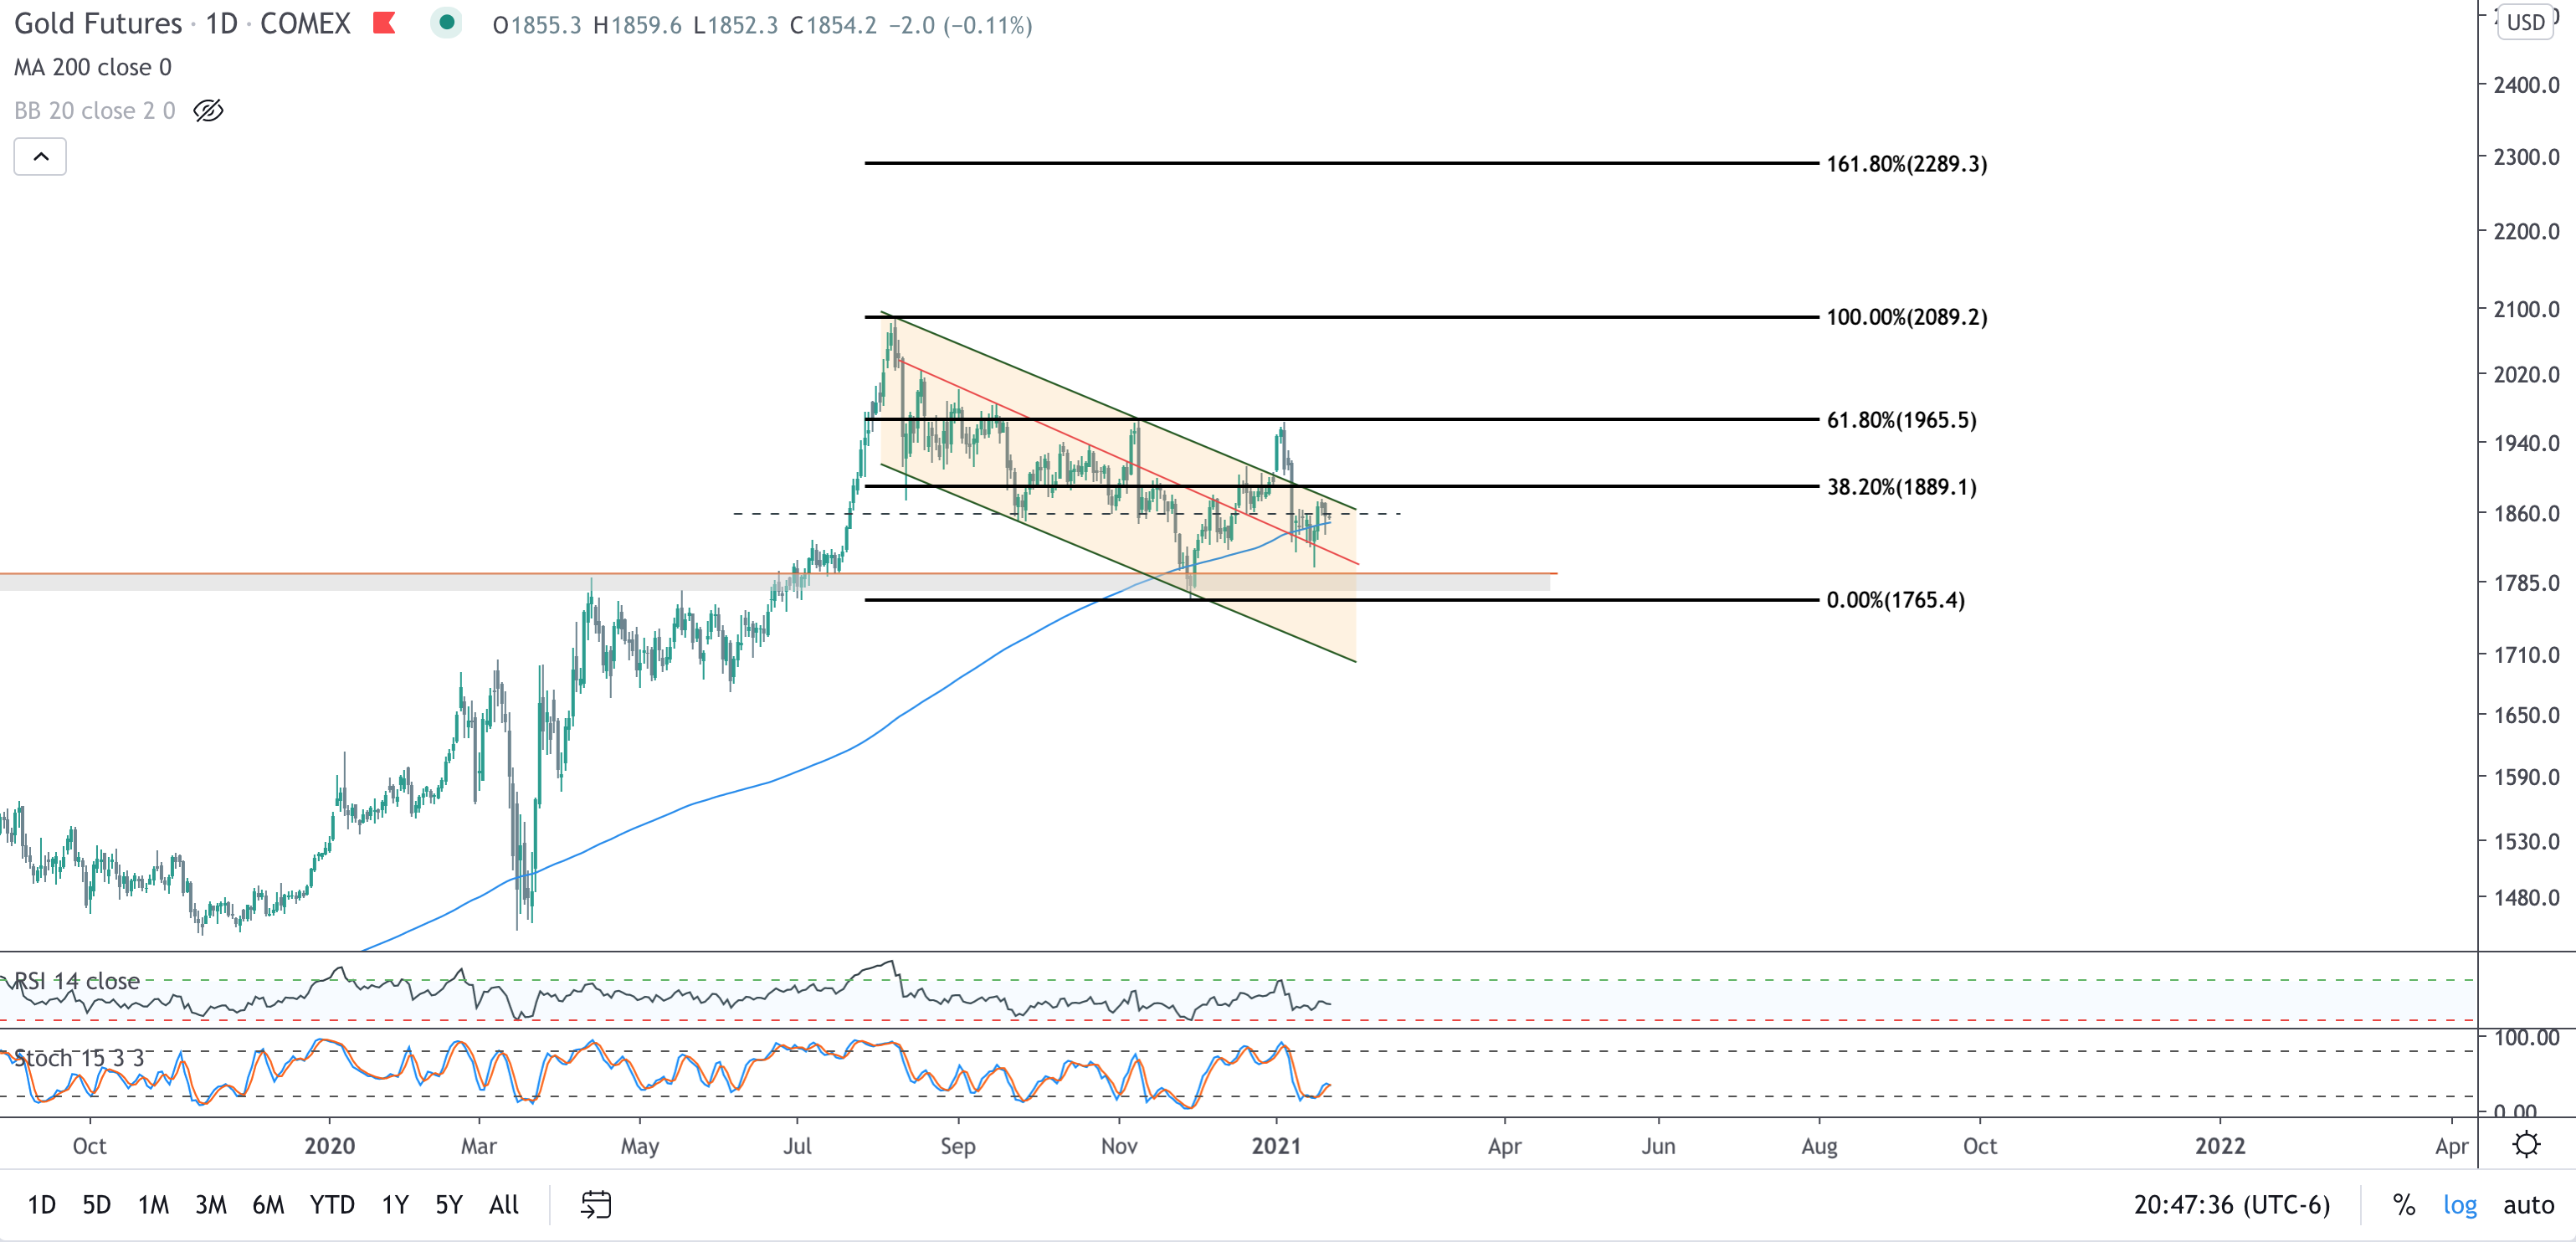
On the positive side, price recently recovered the 200-day moving average, stochastics have turned up, and despite the rapid selloff earlier in the month, the daily RSI never hit oversold conditions. Instead price has been stuck in no man’s land between 1800-1900 per ounce. The next real move can’t begin until gold recovers $1890 to break falling resistance and hurdle the 38.2% Fib retracement.
Silver & Platinum
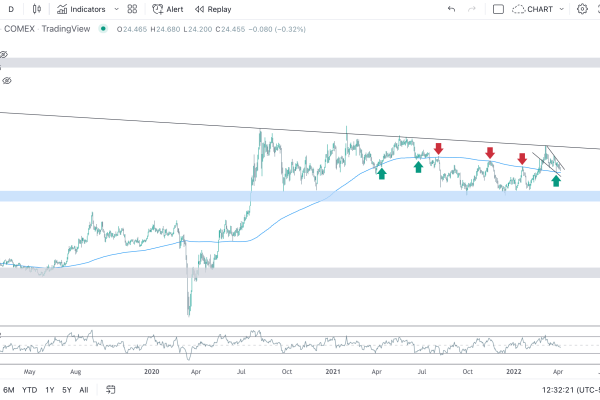
While gold has struggled, silver and platinum have remained surprisingly resilient. The higher beta cousins of the yellow metal tend to trend with gold, but more dramatically in percentage terms. It would seems both are being supported by the run-up in base metals, as each have industrial properties that are far broader than gold. In fact, on several occasions this month silver and platinum have traded up on days when gold has traded down. Silver remains stuck at long term support between $25-$26, nearly broke rising trend support with intraday dips into the $24 range, only to close above support. It’s now decision time as price is pinching between horizontal resistance and rising support. A key pivot point is $26.07, and a secular breakout occurs above $28.11.

For platinum, $1200 is the key level to watch. As platinum approaches $1200, I would expect to see some consolidation or a pullback as it builds the necessary power to break through long term resistance. This has been the key level since 2014. A break above $1200 opens up a move to $1300, above which would be extremely bullish.

Dollar
The recent dollar rebound has been the major headwind for the metals. As I stated in a previous post, the trend remains down and all signs point to further weakness. One final thrust towards 91 seems plausible, but ultimately price seems destined for 88.

S&P 500
The inflation narrative and weakness in bonds have supported higher equity prices. The Nasdaq in particular is an unstoppable train. Equity markets across the globe have been breaking out, and risk appetite is growing. Whatever you may think about valuations and the weakness of underlying economic conditions, all signs point toward higher equity prices ahead. For the S&P 500, 4000 is an important psychological level, with my near term target pushing to 4150.

As always, we appreciate your feedback!
Dollar Movement Will be Key in 2020
Energy
Precious Metals
Currencies
Fixed Income
Equities
Price Prepping for New 7-Yr Highs?
Happy New Year! We are kicking off the New Year with stocks at all-time highs, oil prices spiking on Middle East tensions, and the precious metals complex following through nicely for our November/December videos. If you haven’t had a chance to watch those videos, they offer a helpful background on the technical setup for metals and the price action we are seeing today.
Gold, Silver, Platinum, Palladium, and Copper
In this week’s video I take a look at the charts of gold, silver, platinum, palladium, and copper and offer some thoughts on where I see prices moving next. In the case of gold, which has enjoyed a fantastic run-up from $1180 to $1570 this year (in the process breaking out of a six year base), price is pulling back and bull flagging at the 61.8% Fibonacci retracement. Does it make a push down to $1400 to backtest the entire move? Will silver find support at $16.60 or are we moving lower? Will palladium continue its historic march hire, or will it meet resistance at future levels?
I discuss all this and more in today’s ten minute video. As always, whether you agree or disagree with my analysis, I would love to hear your feedback.
Platinum Testing Downtrend Line With Potential Upside Breakout?
Platinum has underperformed gold since the ratio double bottomed in 2014. This has been especially frustrating for bulls as platinum’s cousin in the PGM group – palladium – has burst to all-time highs through the same period. (more…)
Gold looks bullish; Platinum, not so much
Here is a quick snapshot of the metals sector. The silver chart above is constructive, as silver broke out of a falling wedge and confirmed the bullish action in gold. It also successfully hit its initial target of $15.15-$15.20. The support levels to watch now are $14.30-$14.50, where silver may retest falling wedge support (formerly resistance) and the trend line from the August lows. A break above $15.20 should target a move to $16.20. (more…)


