Test of 30-year highs rejected this week
After a quick mid-summer vacation I am finally getting back into the swing of things here. I’d like to kick off a few posts this week by highlighting the move in silver and specifically the gold/silver ratio.
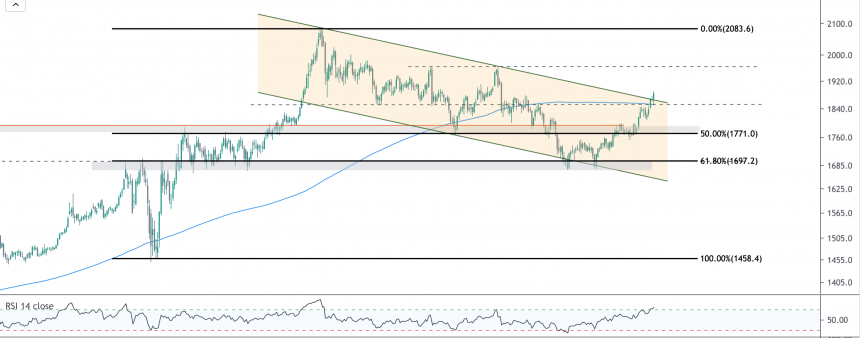
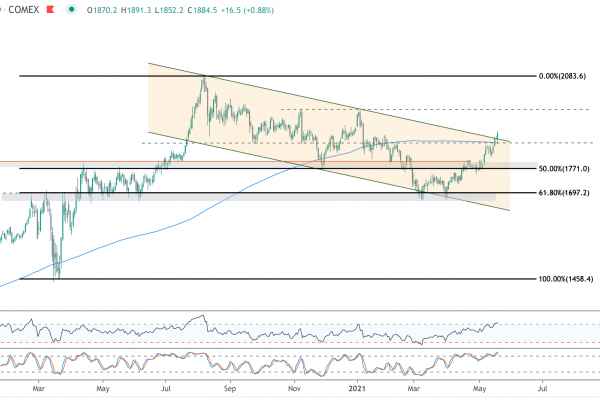
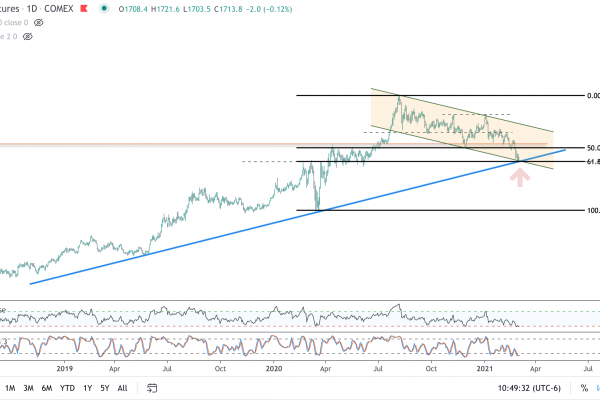
As we have discussed at length in previous posts, the story this summer has been gold breaking out of a six-year base at $1365 and finally showing signs of strength after may false starts. What has made many gold bulls lingering skeptics has been the performance of silver, which is a smaller market with higher beta. Generally, when gold goes up, silver goes up much faster. When gold goes down, silver goes down much faster.
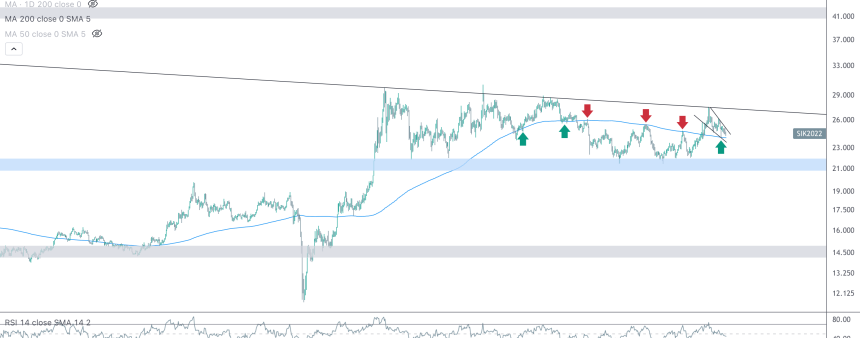
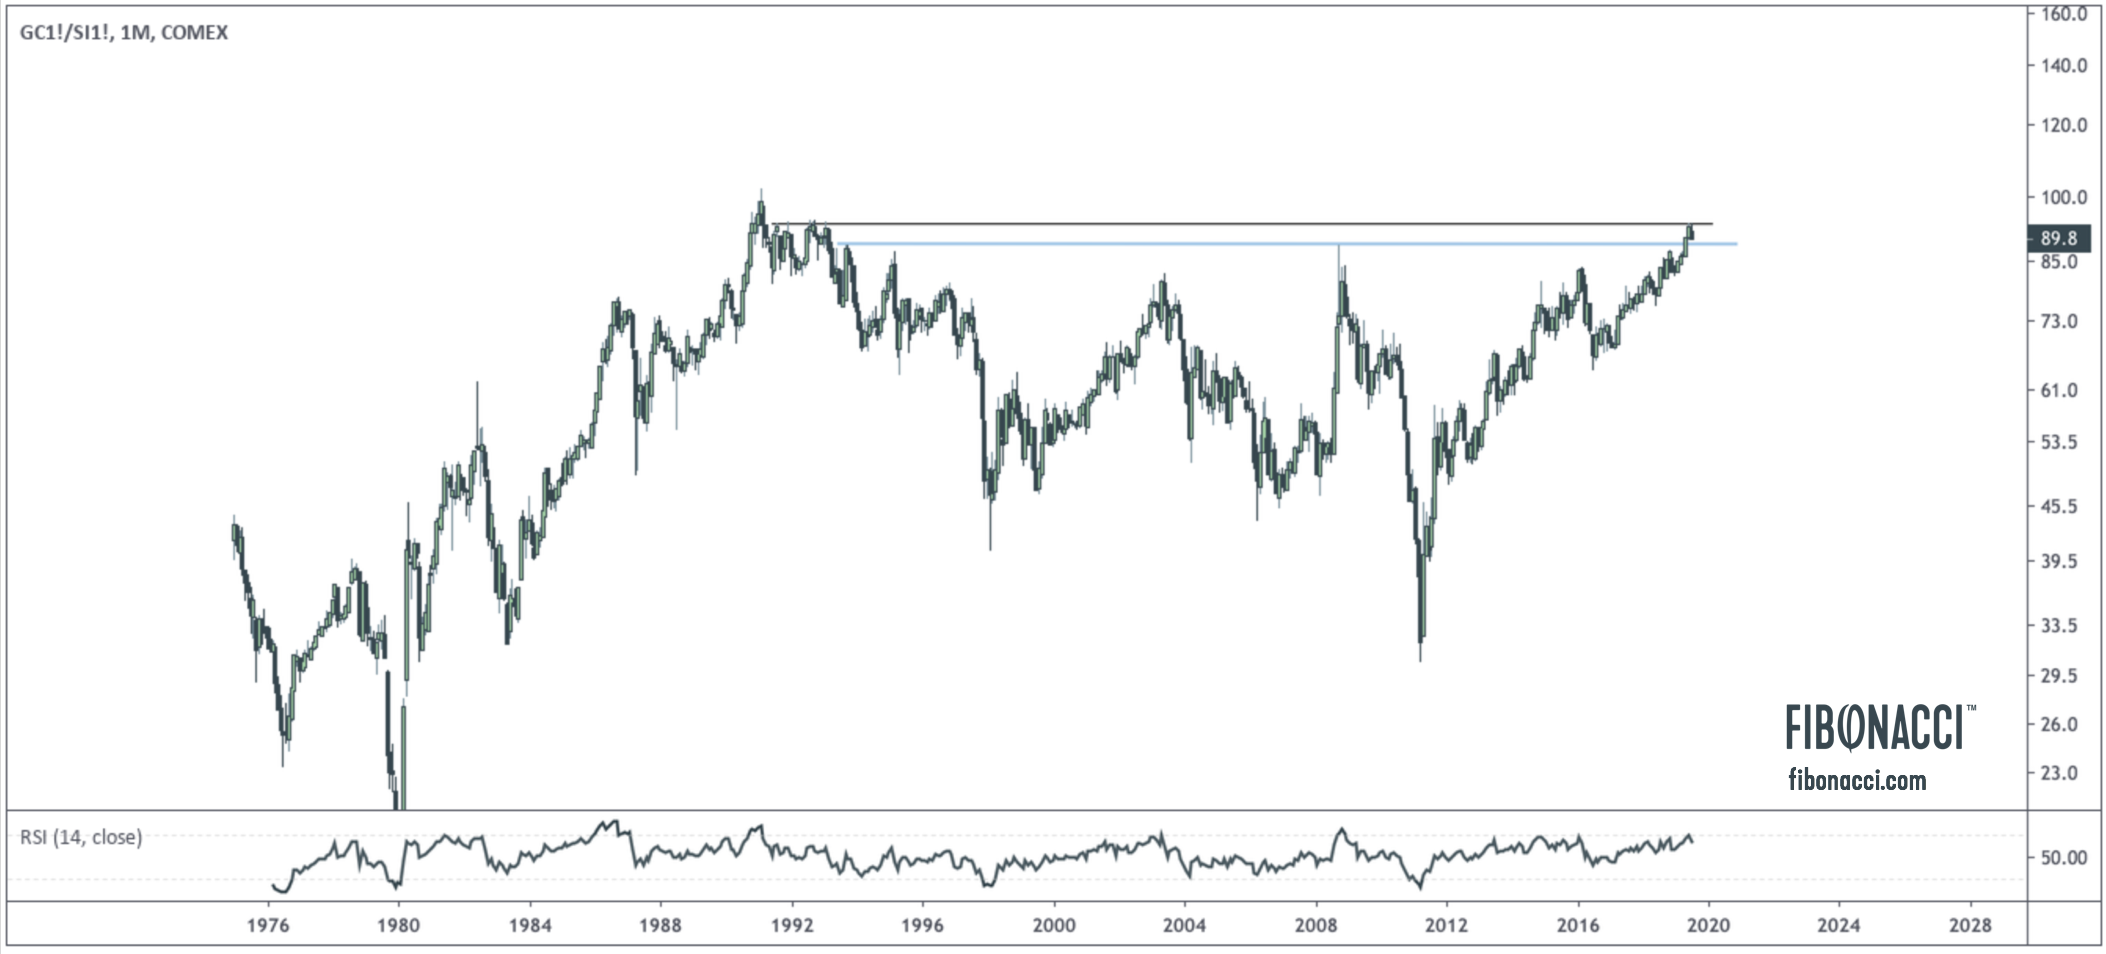
In this rally, silver has been a major laggard, and price action has been muted with volatility at historic lows. This decoupling in price action relative to gold has created a push to 30-year highs in the gold/silver ratio, causing some to speculate that silver is undervalued relative to gold.

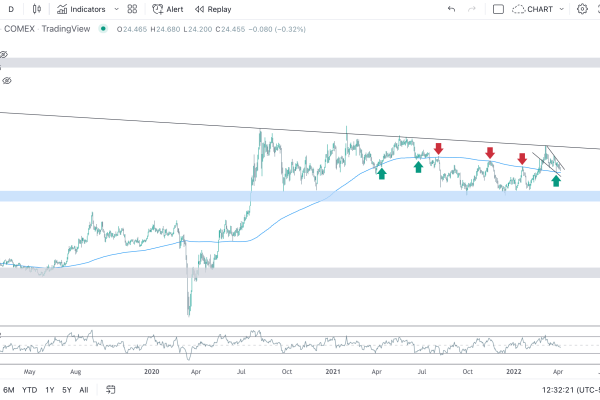
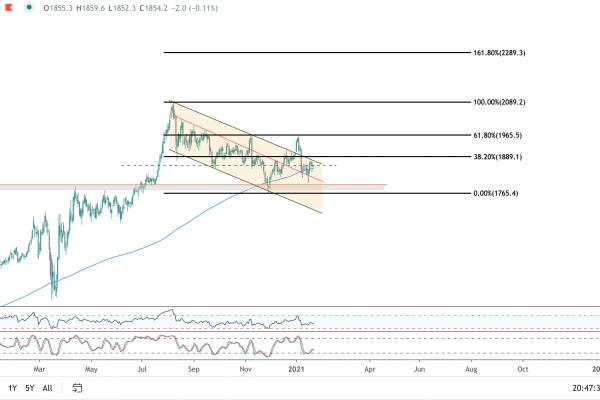
Tuesday’s price action showed the firsts signs of a possible reversal, with a significant breakout in silver while gold remained flat, roughly $40 away from near term highs.

The target for this move is 16.20 at prior resistance. A break of that level, along with a break of the downtrend line, would signal a much bigger secular move.
In the meantime, the gold/silver ratio has tested 30-yr highs three times before falling away hard on yesterday’s move. The daily chart below depicts the significant rejection at resistance, which should be very encouraging for silver bulls. The ratio should move to at least 87 on this thrust.

Charts Above Made Using TradingView
Related Posts