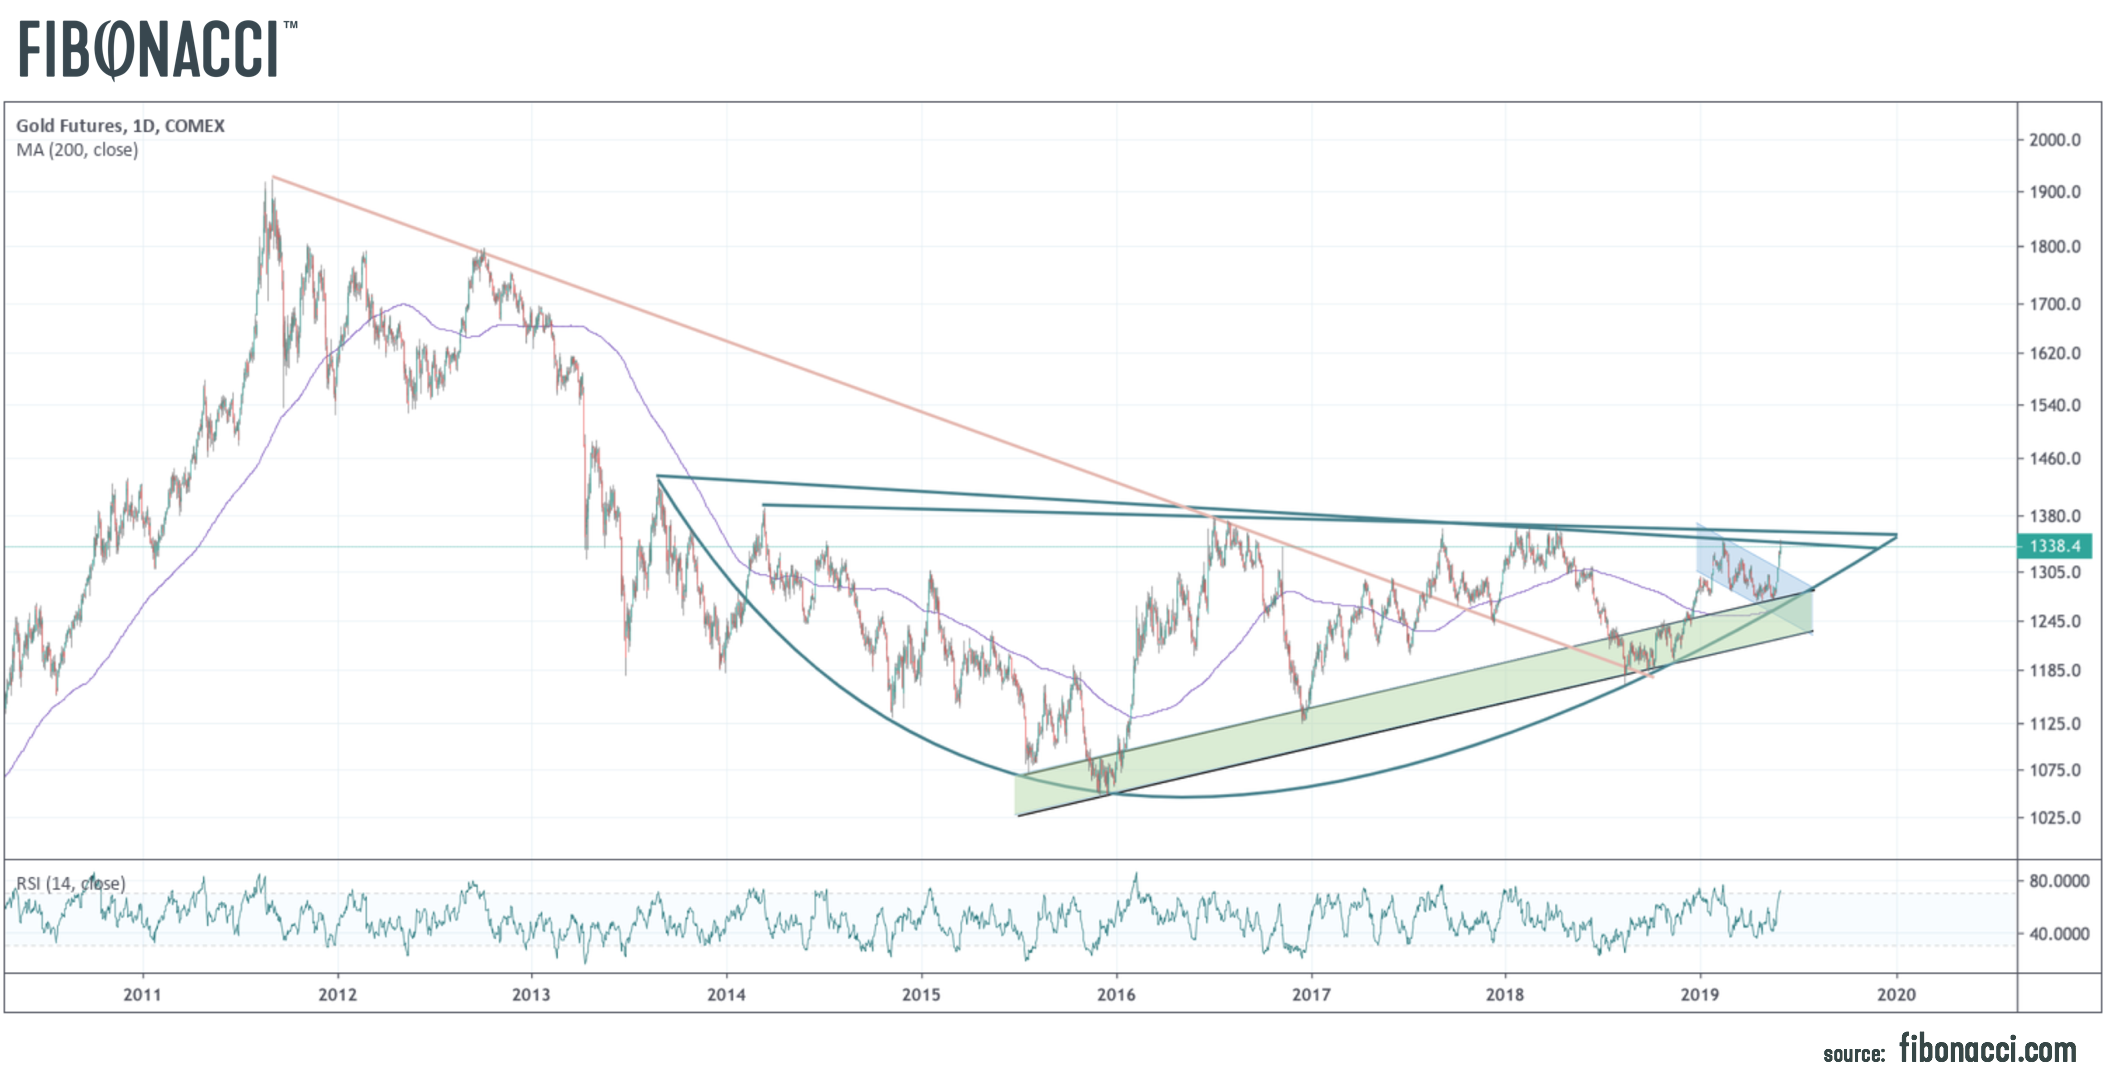
 Gold retested $1350 in overnight trading, extending this current move more than $84 in the last couple of months. The chart above is admittedly busier than I generally like, but so much is happening technically with the gold price.
Gold successfully retested falling support from the 2011 peak (red line) at $1180 in late-2018. This coincided with a successful retest of rising support from the 2015 low. Gold is now meeting resistance from prior peaks between 1350-1370 during every attempt over the last 6 years to break out.
It would seem very plausible that gold could make one final retest at the $1280 level where two channel support lines converge with arc support and the 200 day moving average. This would likely wash out all new gold bulls.
The gold chart is very bullish and could easily break through six years of resistance within the next few months. Conversely, a break of $1280, while lower probability in my estimation, would do significant technical damage. Either way, up or down, the remainder of the year should reignite gold volatility and define the prevailing trend for years to come.
Related Posts