RSI Turning Higher
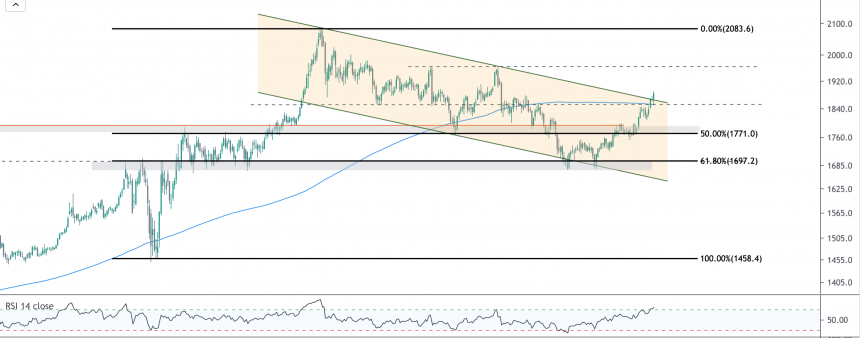
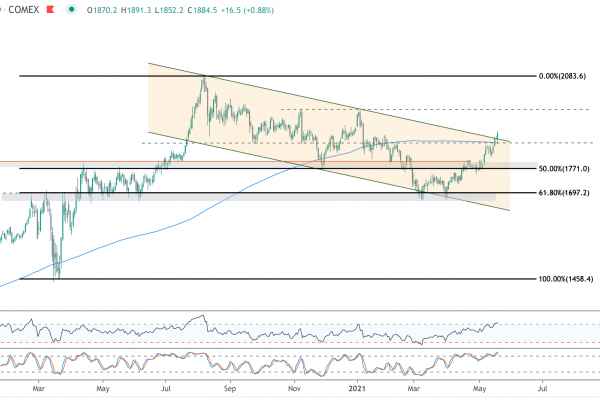
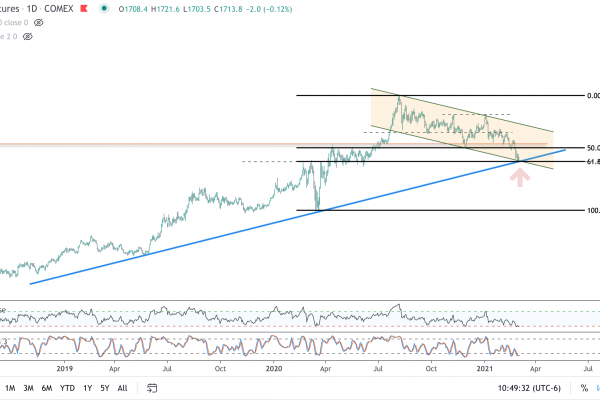
The run-up in gold this morning has price action testing the downtrend line from the September high for the fourth time. Gold has been forming a bull flag for the past eight weeks, and $1505 also coincides with the 38.2% Fibonacci retracement from the September high to the October low. Bulls want to see a breakout here; a failure would likely weigh heavily on price and take gold to new multi-month lows at downtrend support. RSI is supporting bullish action and is breaking out of its multi-week downtrend. The bond market is also acting bullishly after cooling off recently, as highlighted in my analysis of TLT, which is also supportive of higher gold prices.
A gold breakout here should see gold test $1528 on the next leg higher.

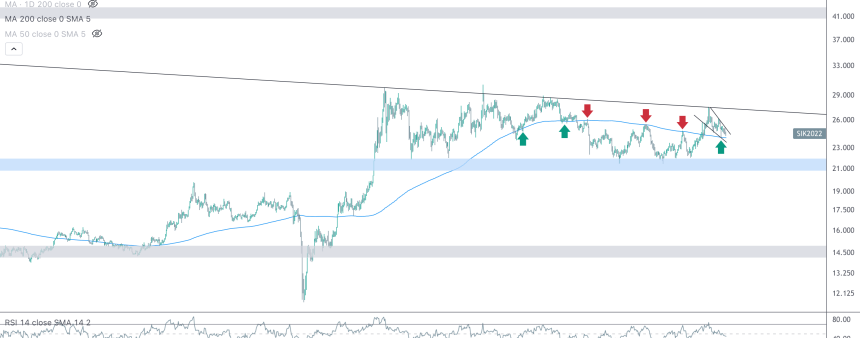
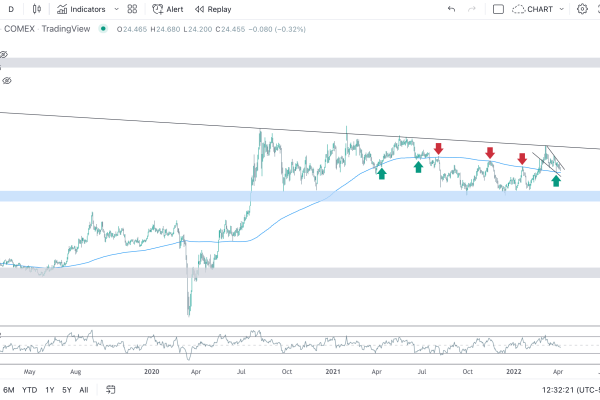
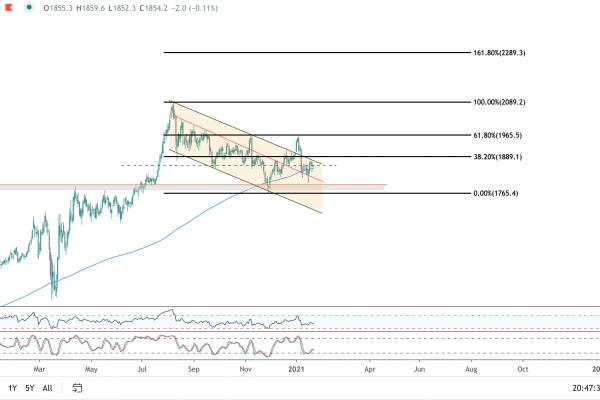
Silver is also pushing up from its downtrend lines. Bulls wants to see silver drive through $18.02 above the 38.2% Fibonacci retracement to set up another push to $18.70. Like gold, the RSI for silver is just now turning up, signaling renewed strength following the multi-week pullback.
Related Posts